PlatiPy documentation#
PlatiPy#

Processing Library and Analysis Toolkit for Medical Imaging in Python#
PlatiPy is a library of amazing tools for image processing and analysis - designed specifically for medical imaging!
Check out the PlatiPy documentation for more info.
This project was motivated by the need for a simple way to use, visualise, process, and analyse medical images. Many of the tools and algorithms are designed in the context of radiation therapy, although they are more widely applicable to other fields that use 2D, 3D, or 4D imaging.
PlatiPy is written in Python, and uses SimpleITK, VTK, and standard Python libraries. Jupyter notebooks are provided where possible, mainly for guidance on getting started with using the tools. We welcome feedback and contributions from the community (yes, you!) and you can find more information about contributing here.
What can I do with platipy?#
A lot! A good place to start is by looking in the examples directory.
Some examples of what PlatiPy can do:
DICOM organising and converting:
Bulk convert from multiple series and studies with a single function
Convert DICOM-RT structure and dose files to NIfTI images
Create DICOM-RT structure files from binary masks e.g. from automatic contouring algorithms
Image registration
Register images and transform labels with a few lines of code
Linear transformations: rigid, affine, similarity
Non-linear deformable transformations: demons, b-splines
Multiple metrics for optimisation
Atlas-based segmentation
A suite of tools that can be used out-of-the-box
- Includes advanced algorithms for
Synthetic deformation field generation
Simulate anatomically realistic shifts, expansions, and bending
Compare DIR results from clinical systems
Basic tools for image processing and analysis
Computing label similarity metrics: DSC, mean distance to agreement, Hausdorff distance, and more
Cropping images to a region of interest
Rotate images and generate maximum/mean intensity projections (beams eye view modelling)
A major part of this package is visualisation, and some examples are shown below!
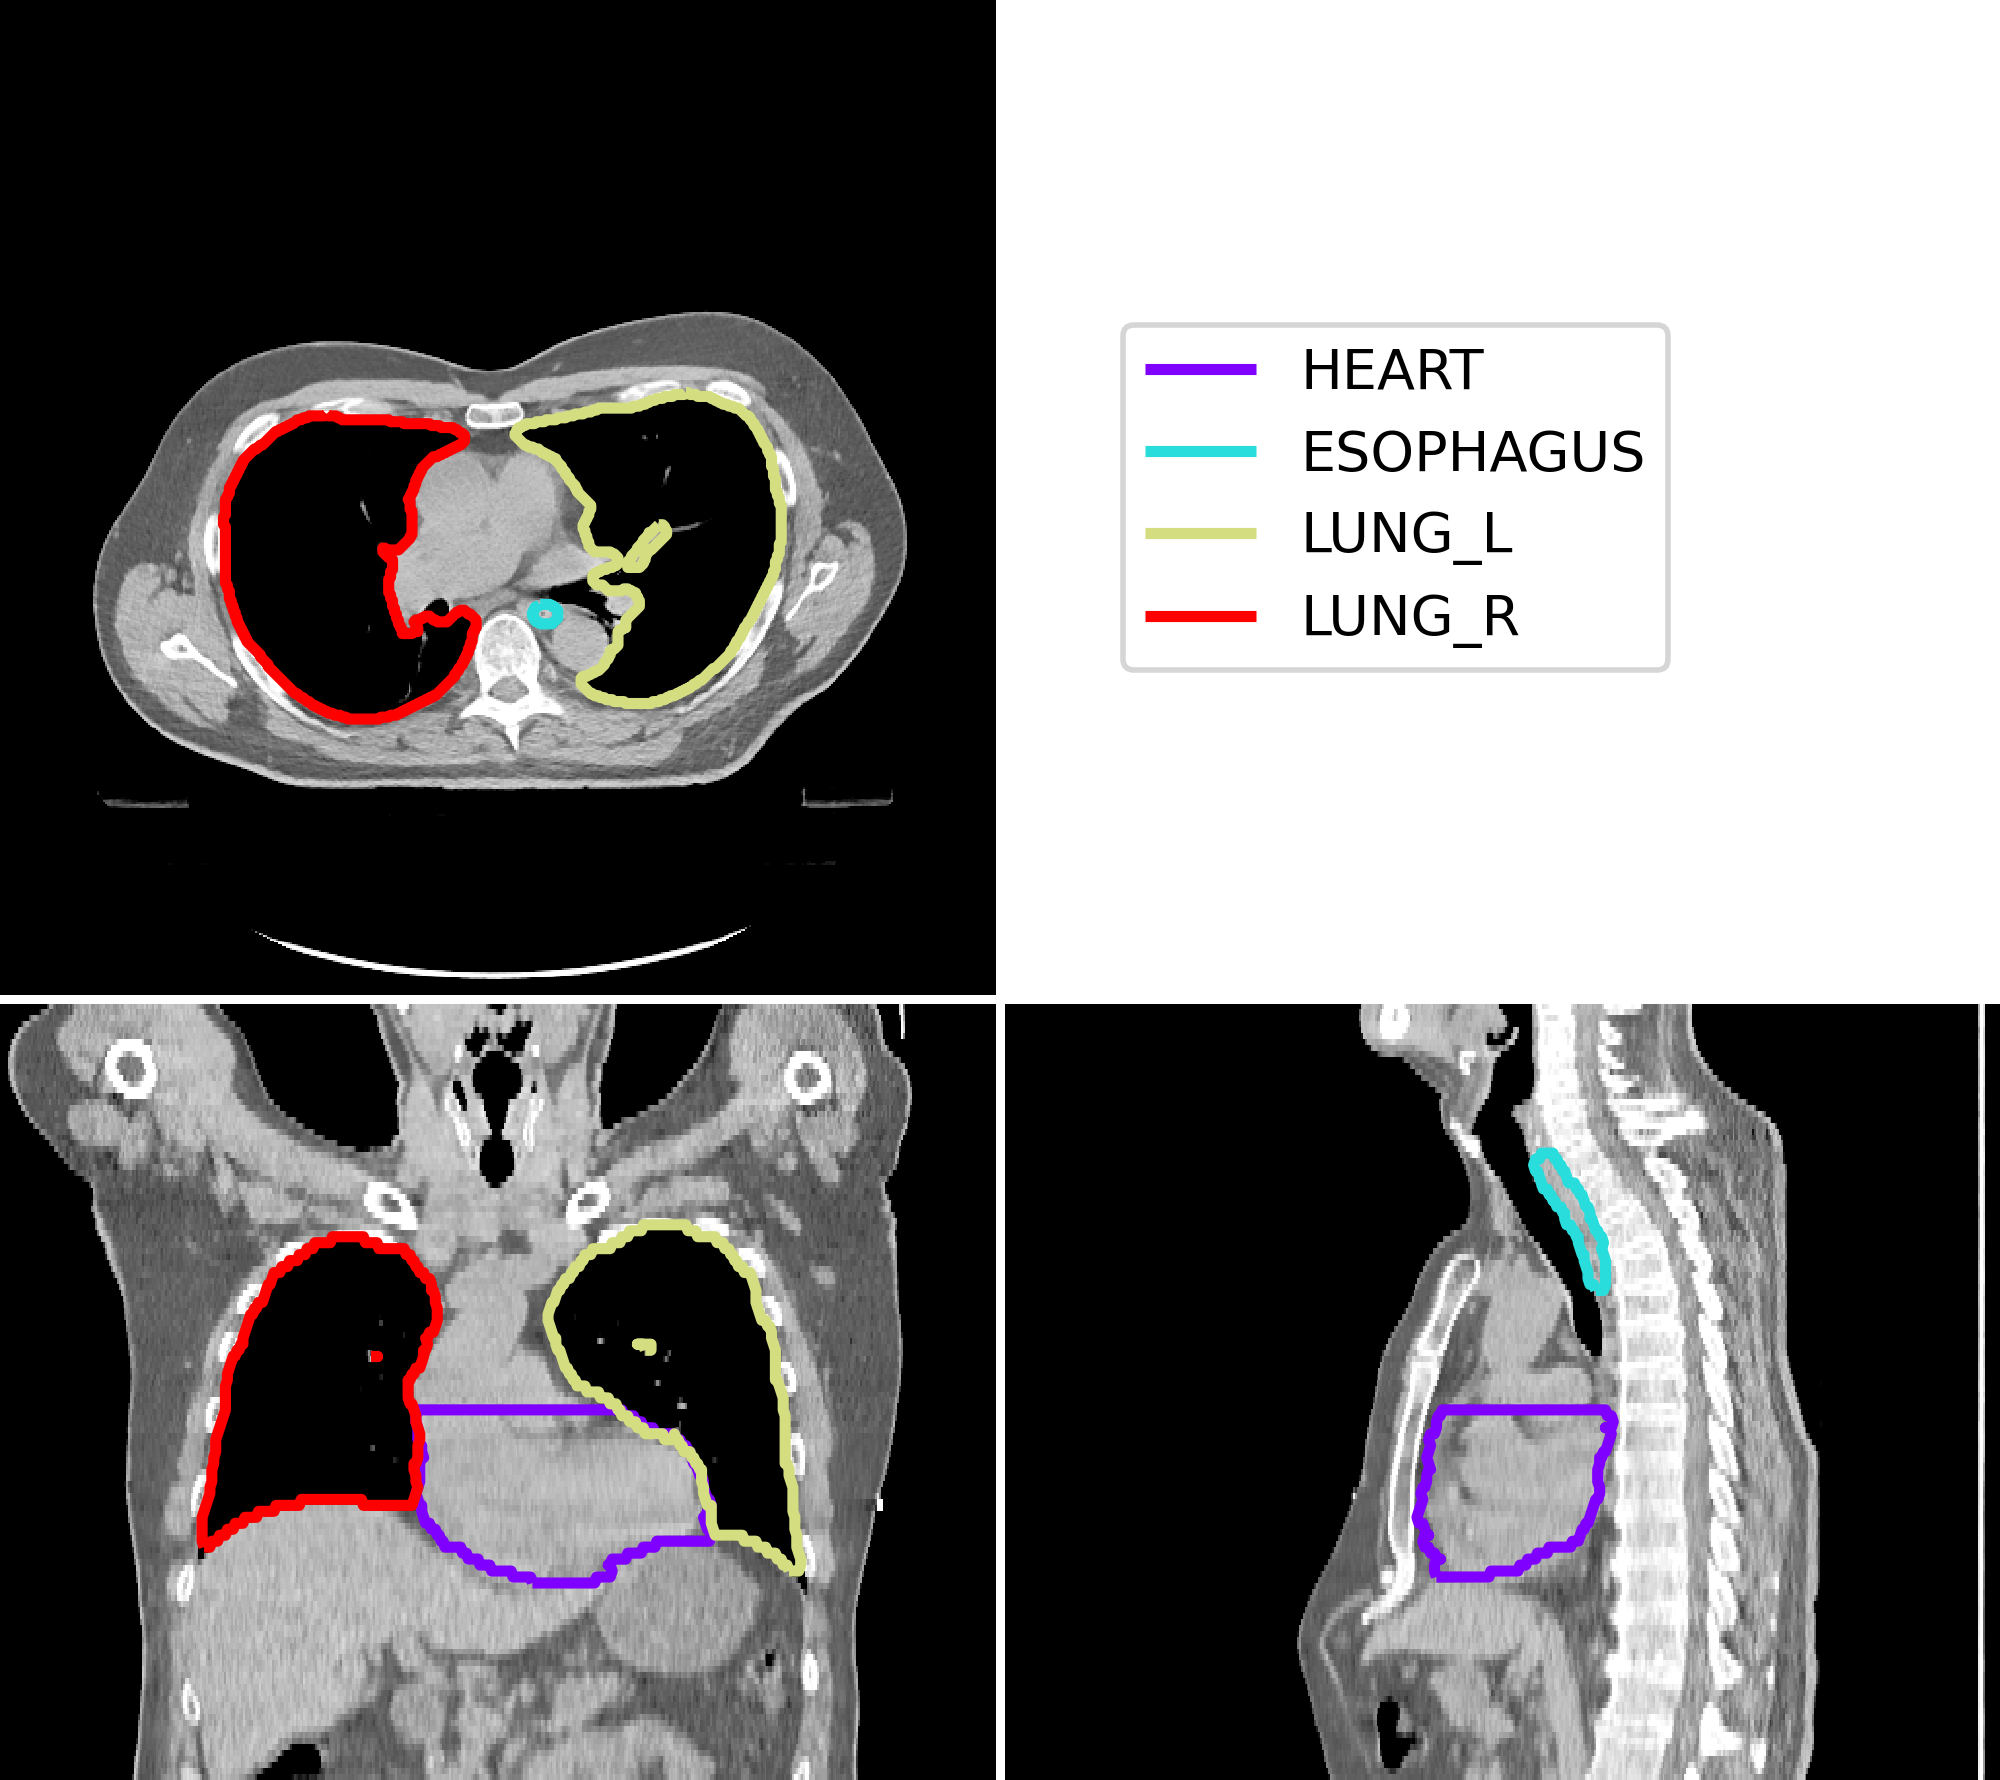
Visualise some contours#
from platipy.imaging import ImageVisualiser

vis = ImageVisualiser(image)
vis.add_contour(contours)
fig = vis.show()
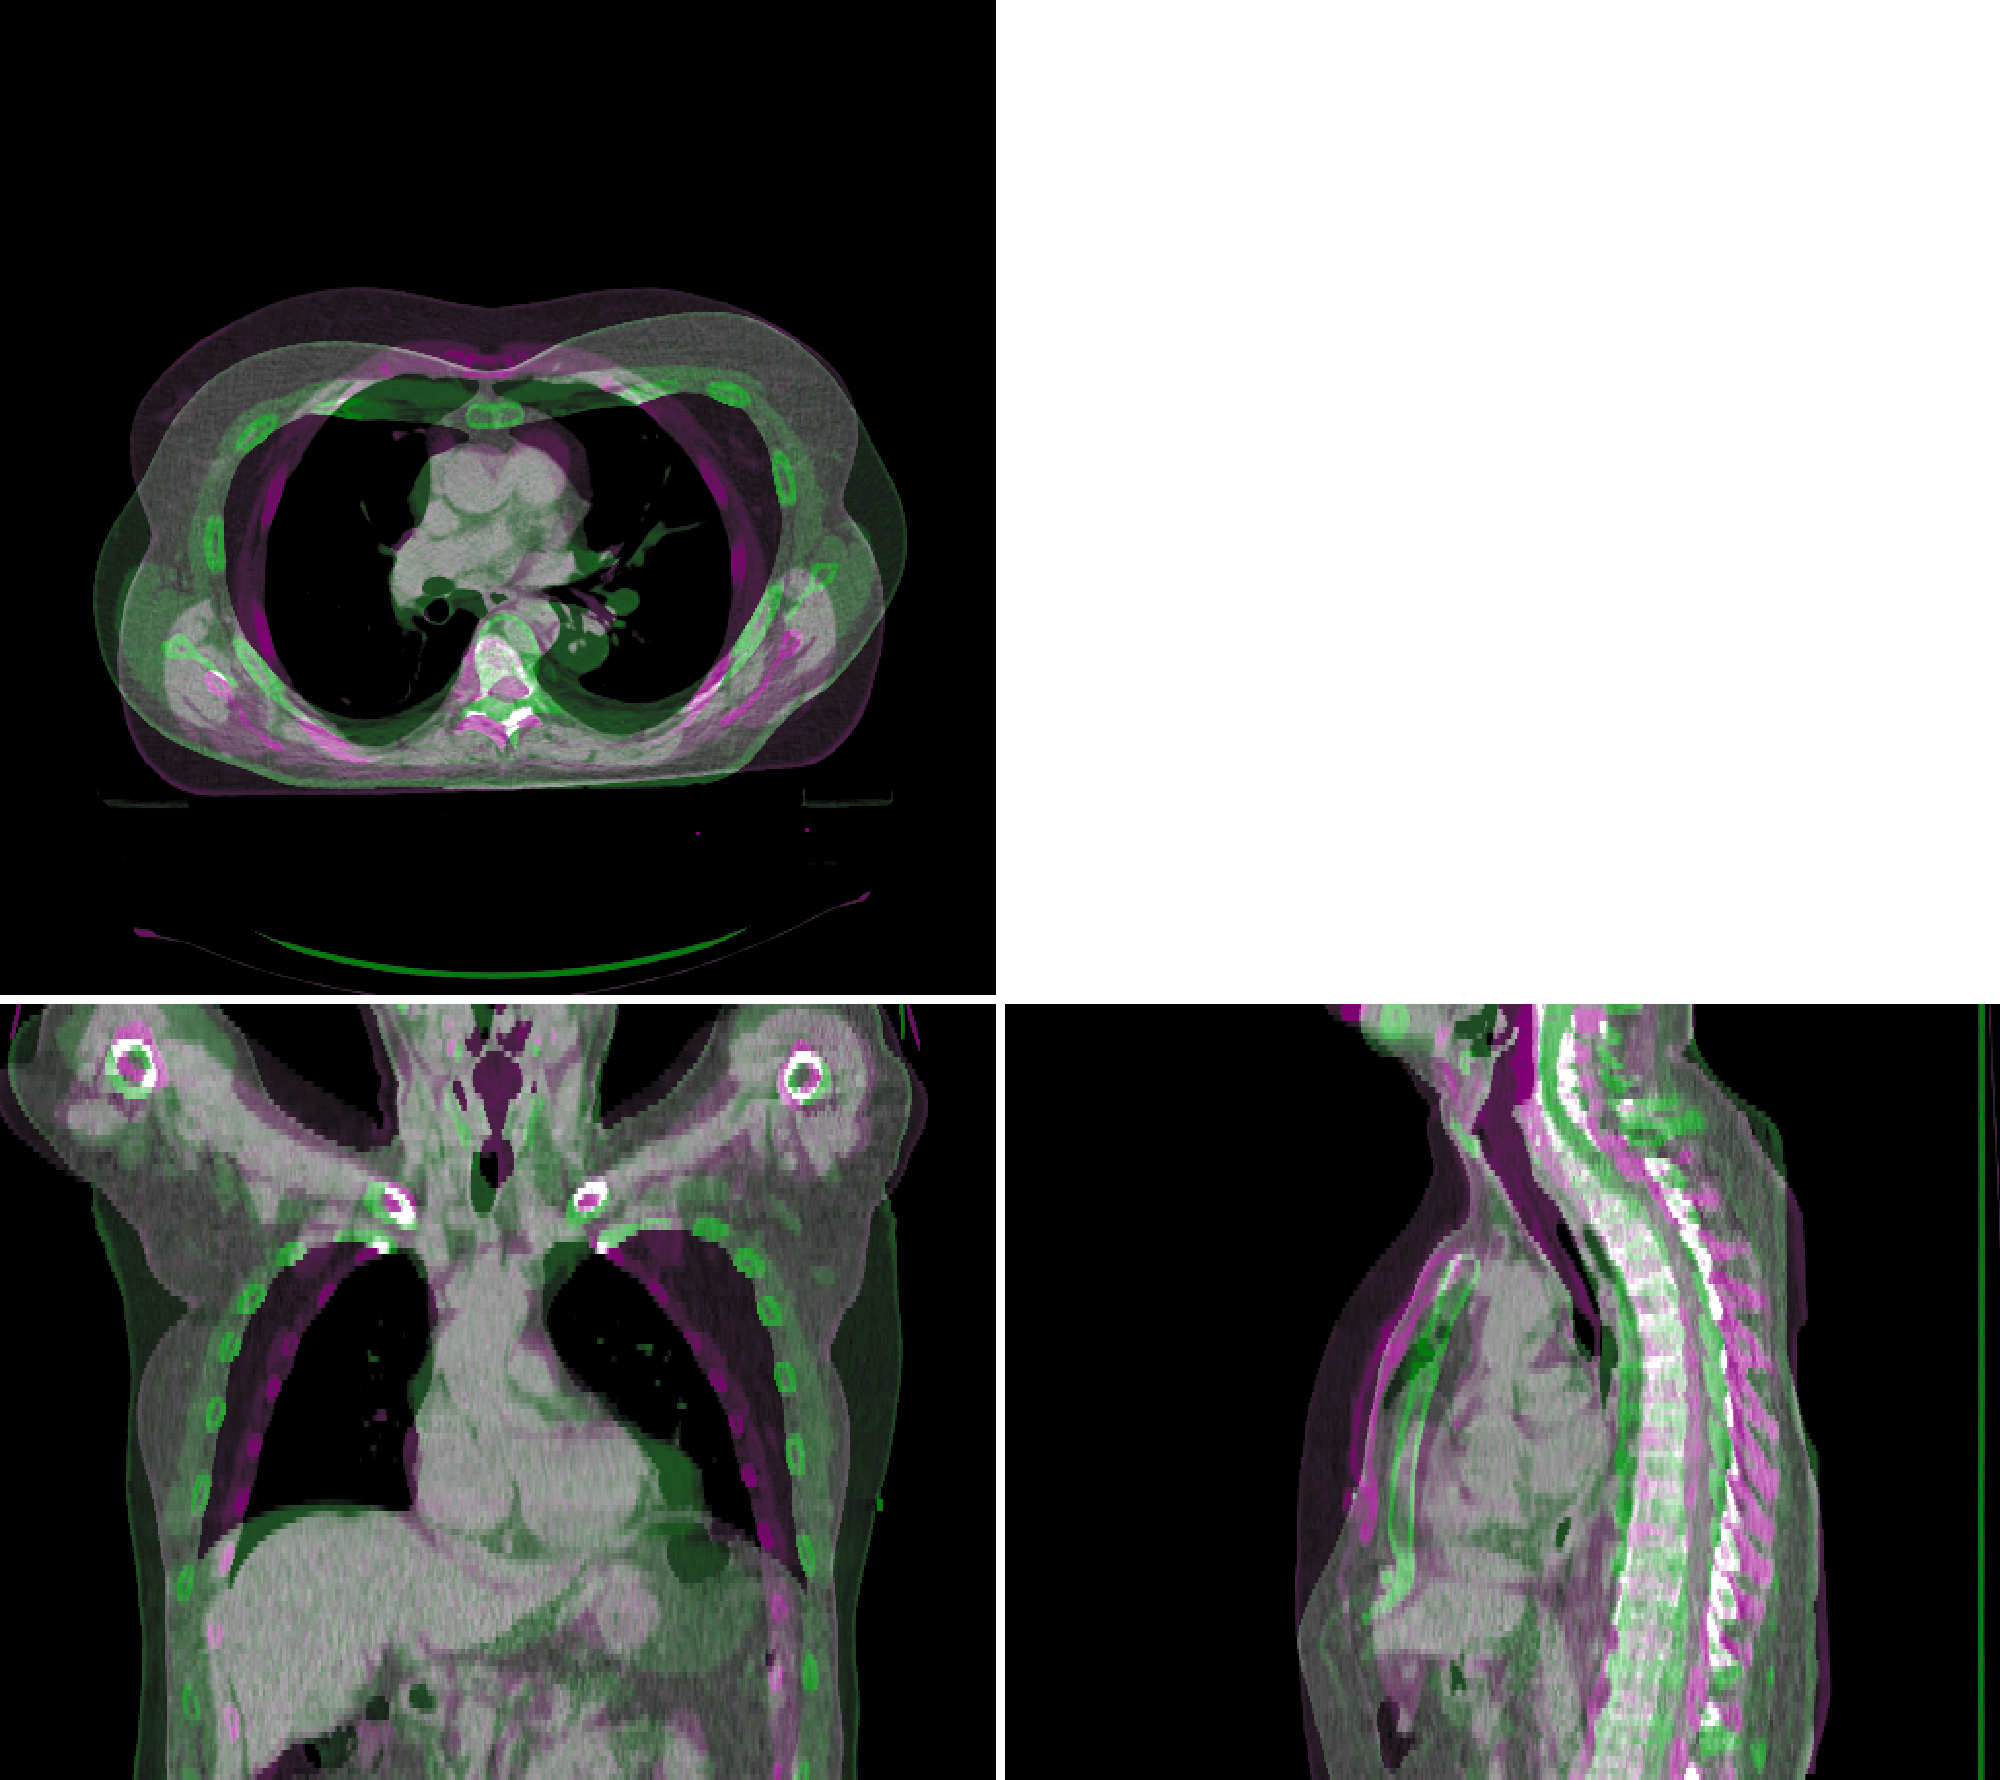
Register some images#
from platipy.imaging.registration.linear import linear_registration

image_2_registered, tfm = linear_registration(
image_1,
image_2
)

vis = ImageVisualiser(image_1)
vis.add_comparison_overlay(image_2_registered)
fig = vis.show()
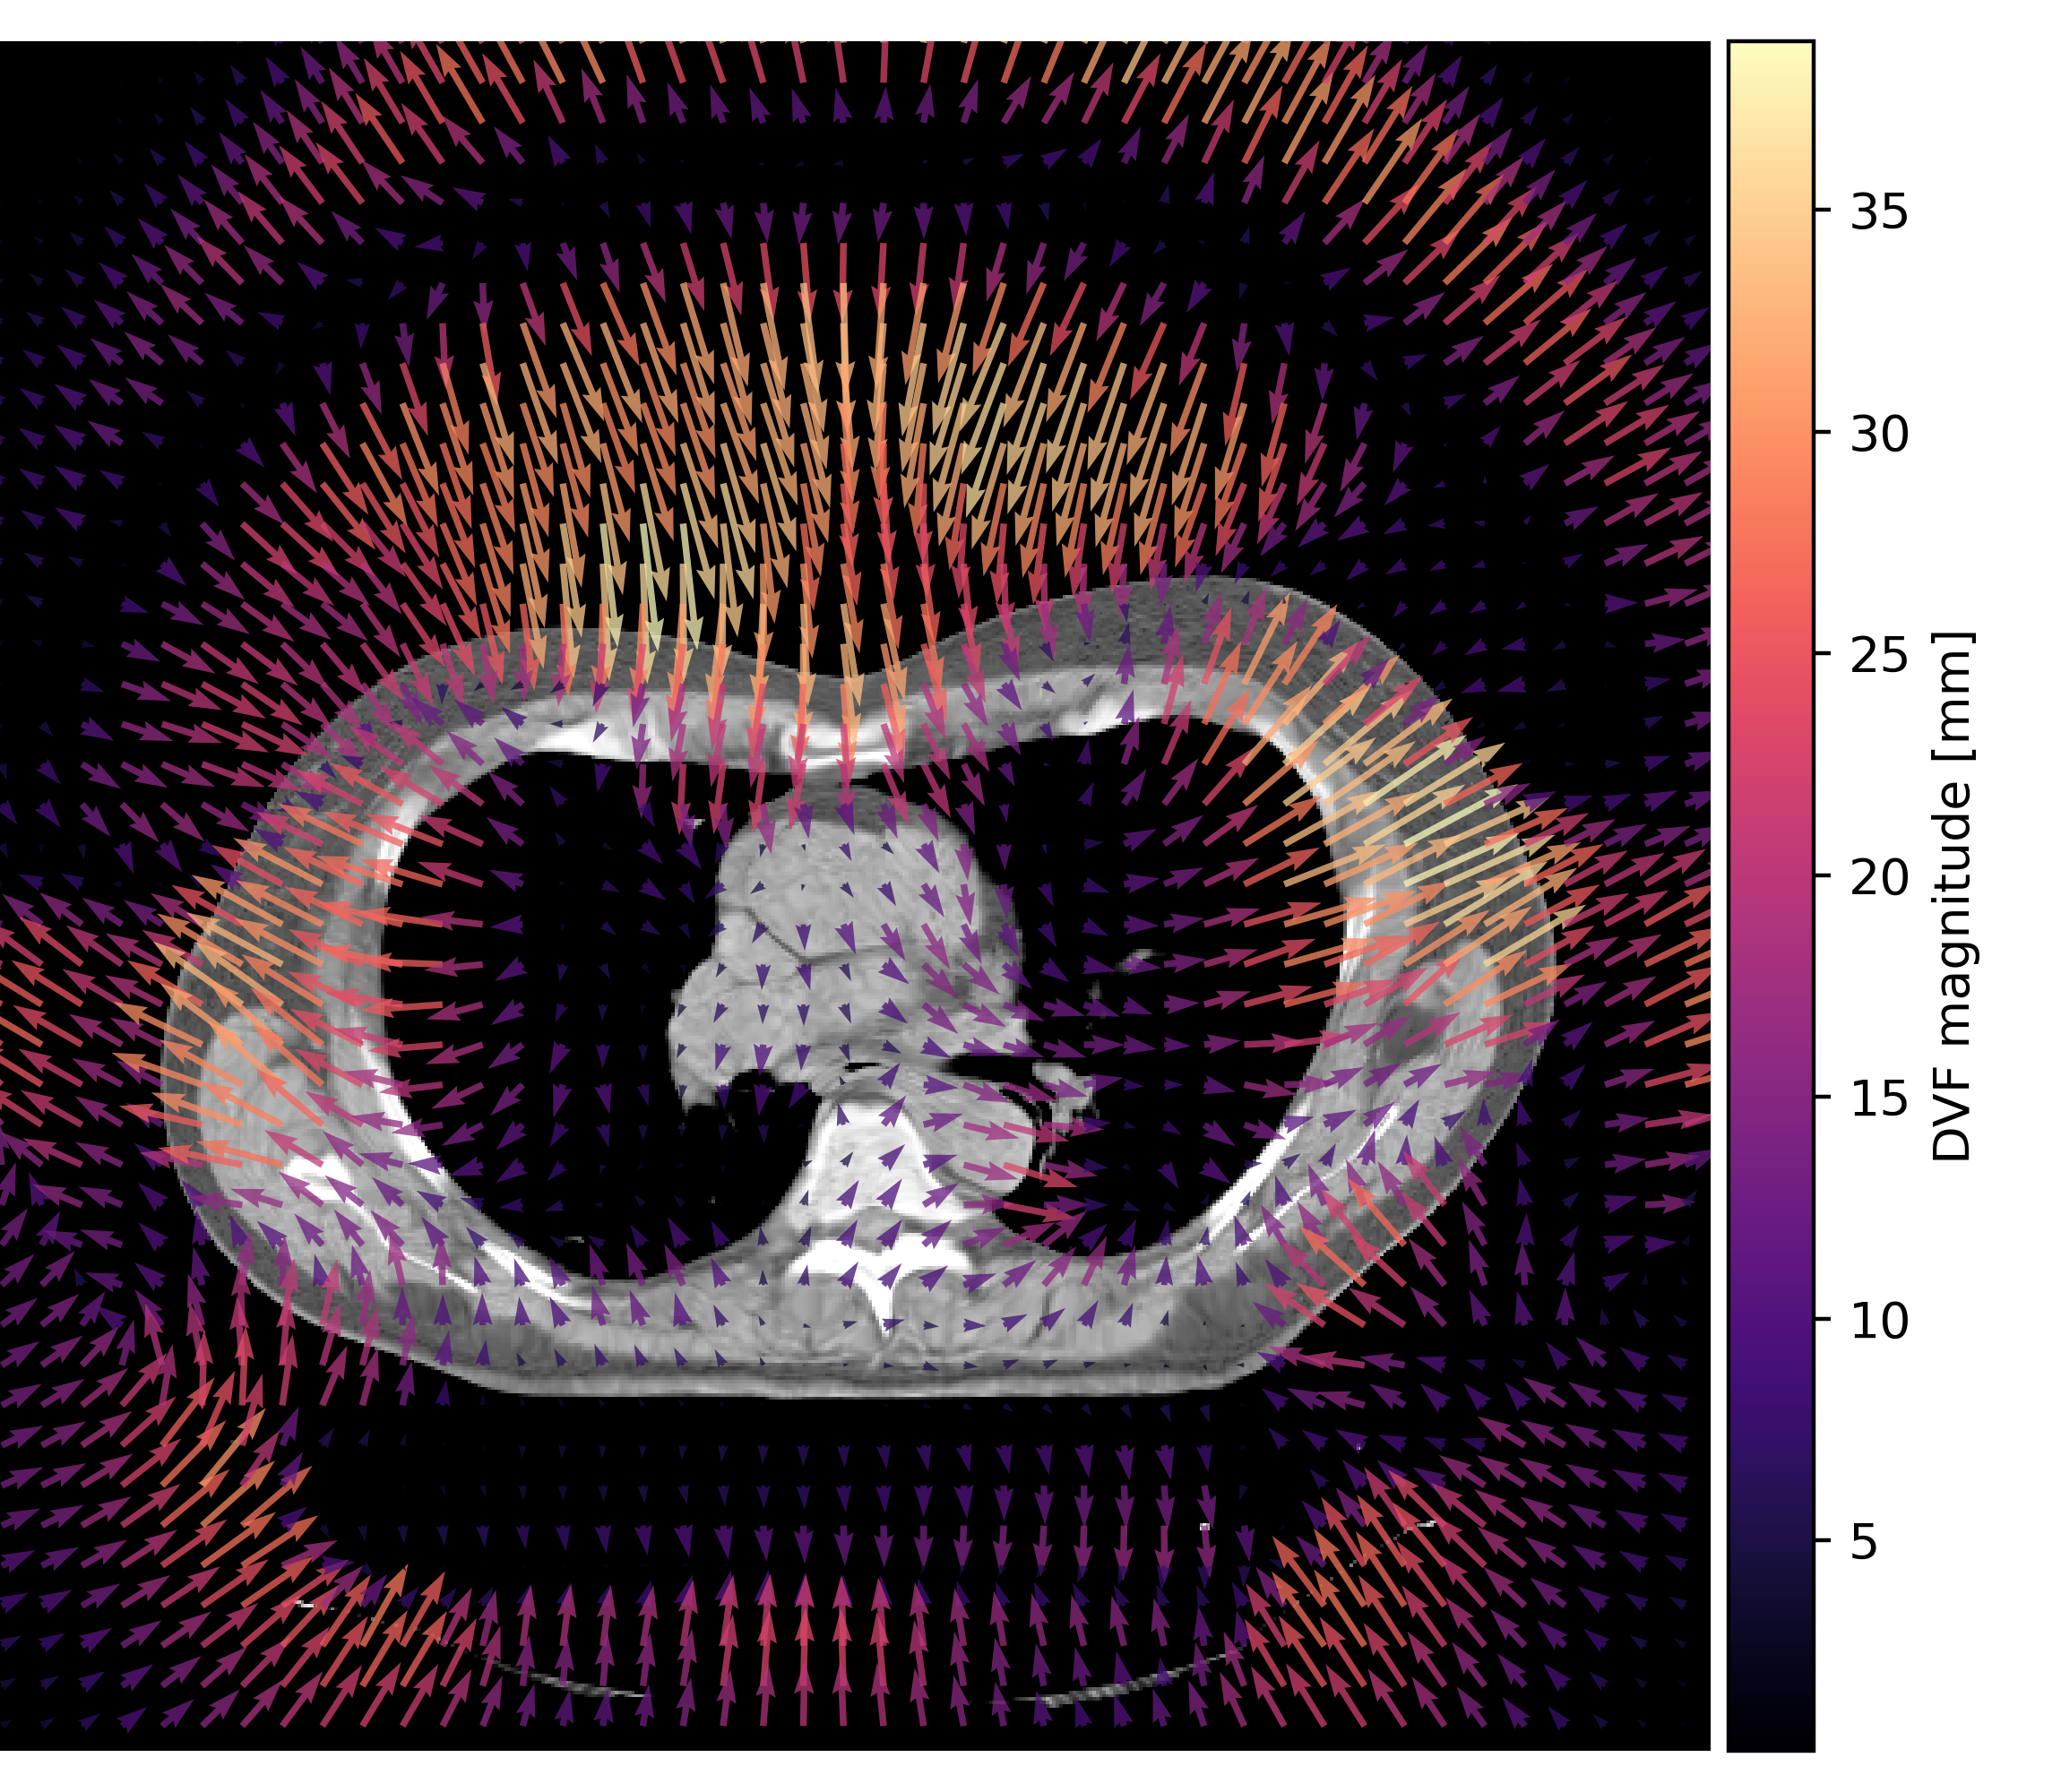
Calculate deformation vector fields#
from platipy.imaging.registration.deformable import fast_symmetric_forces_demons_registration

image_2_deformed, tfm_dir, dvf = fast_symmetric_forces_demons_registration(
image_1,
image_2_registered
)

vis = ImageVisualiser(image_2_deformed, axis="z")
vis.add_vector_overlay(
    dvf,
    subsample=12,
    arrow_scale=1,
    arrow_width=2,
    colormap=plt.cm.magma,
    name="DVF magnitude [mm]",
    color_function="magnitude"
)
fig = vis.show()
Getting started#
There aren’t many requirements, just an installed Python interpreter (3.7 or greater). PlatiPy can be installed with pip:
pip install platipy
The base installation of platipy does not include some large libraries needed for various components of platipy. The following extras are available to install to run specific platipy tools:
pip install platipy[cardiac]
pip install platipy[nnunet]
pip install platipy[backend]